Where the techniques of Maths
are explained in simple terms.
Probability - Discrete distributions - Expected value and variance.
Test Yourself 1.
- Algebra & Number
- Calculus
- Financial Maths
- Functions & Quadratics
- Geometry
- Measurement
- Networks & Graphs
- Probability & Statistics
- Trigonometry
- Maths & beyond
- Index
| Calculate mean (expected value). | 1. A probability distribution is summarised as:
Determine the value of E(x). Answer.5.2. |
2. A random variable X represents the number of cars crossing a particular intersection in a 10 minute interval.
The random variable is known to have the following probability distribution:
What is the expected number of cars expected to cross the intersection in 10 minutes? Answer.2.2 cars. |
||||||||||||||||||||||||
3. In a fund-raising raffle for the school, 500 tickets are printed.
First prize is $200 and there are four second prizes of $25 each.
Answer.$1.65. |
||||||||||||||||||||||||||
| 4. A book store keeps records about the number of book purchased by customers.
The store owner deduces from the data that the probability of customers purchasing no books is 0.5, of purchasing one book is 0.3 and of purchasing 2 books is 0.2. What is the expected number of books purchased by customers? Answer.0.7 books. |
||||||||||||||||||||||||||
5. You win a competition and you have a choice from two prizes:
The gold in the coin has a 40% chance of being worth $500, a 50% chance of being worth $400 and a 10% chance of being worth $200. Answer.E(X) = $310. |
||||||||||||||||||||||||||
6. Ellen is considering buying shares in a gold mining company. She estimates she has:
Answer.(i) Expected % is 0.06 = 6%. (ii) Expected profit = $144. |
||||||||||||||||||||||||||
7. The following table, taken from an earlier Australian Census, shows the probability of the number of children under 15 years of age (X) in indigenous families living in a particular area in Western Australia.
|
||||||||||||||||||||||||||
| Calculate the standard deviation. | 8. A random variable X has a probability distribution with a mean of 6 and E(X2) = 52. What is the standard deviation of X? Answer.SD = 9. |
|||||||||||||||||||||||||
| 9. A random variable X has a probability distribution with E(X) = 22 and E(X2) = 565. What is the standard deviation of X? Answer.SD = 9. |
||||||||||||||||||||||||||
| 10. A random variable X has a probability distribution with E(X2) = 25 and a standard deviation of 3.
What is the expected value of X? Answer.SD = 4. |
||||||||||||||||||||||||||
| Calculate both the mean and the standard deviation. | 11. The random variable x has the following probability distribution:
What is the variance of the probability distribution? Answer.Var = 1.2. |
|||||||||||||||||||||||||
12. The discrete random variable X has a probability distribution P(X):
For this distribution, E(X) = 2. Answer.SD = 0.84. |
||||||||||||||||||||||||||
13. Let X be a random variable with the following probability distribution:
Answer.(a) E(x) = 2.0 and V(x) = 1. (b) Yes E(x) is a possible value of X. |
||||||||||||||||||||||||||
14. Let X be a random variable with the following probability distribution:
Answer.(i) μ = 15.75. (ii) σ = 5.76. |
||||||||||||||||||||||||||
15. Let X represent the number of times a Year 12 student visits the nearby Subway shop to buy lunch in a month. The following table shows the probability distribution of X:
Answer.(i) μ = 15.7. (ii) σ = 0.81. |
||||||||||||||||||||||||||
| 16. In a game of chance, a player rolls a six-sided die that is biased so that rolling an even number has twice the probability of rolling an odd number.
the distribution of the discrete random variable X being the number showing of the die is:
Answer.(i) E(X) = 3.7 and var (X) = 2.9. (ii) Need 28 rolls to exceed 100. |
||||||||||||||||||||||||||
17. Tracey and Alyssa are sisters who love to play netball. During the season they each keep a tally of the number of goals they score each game. At the end of the season, they share their match summaries which a shown below.
|
||||||||||||||||||||||||||
18. Jamie is playing a game of cards involving 10 cards - 6 of which are black and 4 are red. Some cards are heavier than others. The 10 cards are thrown in the air and Jamie counts the number of red cards which fall face-up. His results for the number of cards landing face-up and he determines the probabilities to be:
Answer.(i) Expect 1.82 red cards face up. (ii) Var(X) = 0.89 |
||||||||||||||||||||||||||
19. The number of butterflies in a garden at 10:00 am each morning is a random variable summarised in the following table:
Answer.(i) Expect 0.7 butterflies. (ii) SD = 0.78 |
||||||||||||||||||||||||||
20. The random variable X has the following probability distribution:
where k is a constant. Answer.(i) k = 0.125. (iii) E(X) = 3 and Var(X) = 1. |
||||||||||||||||||||||||||
| 21. Each morning outside my front door, the Crested Pigeons congregate waiting for seeds. They are usually in pairs and the following table summarises the probabilities I have estimated on the basis of many mornings of data collection. | 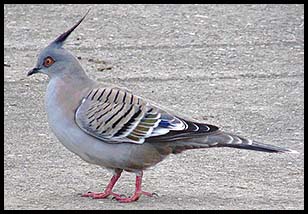 |
|||||||||||||||||||||||||
Answer.(i) Expected no. of pairs = 6.3. (ii) Var(X) = 1.41. |
||||||||||||||||||||||||||