Where the techniques of Maths
are explained in simple terms.
Probability - Discrete distributions - Expected value and variance.
Test Yourself 1 - Solutions.
- Algebra & Number
- Calculus
- Financial Maths
- Functions & Quadratics
- Geometry
- Measurement
- Networks & Graphs
- Probability & Statistics
- Trigonometry
- Maths & beyond
- Index
| Calculate mean (expected value). | 1.
E(x)= 0(0.1) + 1(0.2) + 4(0.4) = 5.2 |
2.
Expected number of cars expected in 10 mins: E(x)= 0(0.05) + 1(0.2) + 3(0.4) + 4(0.05) = 2.2 cars. |
|||||||||||||||||||||||||
3. (i) Summarise the information in a probability distribution table.
|
|||||||||||||||||||||||||||
4. The probability distribution can be written as:
Expected number of books purchased = 0(0.5) + 1(0.3) + 2(0.2) = 0.7. |
|||||||||||||||||||||||||||
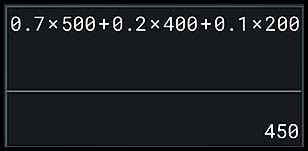
5. The probabiity distribution for the gold can be written as:
(i) E(X) = 0.4(500) + 0.5(400) + 0.1($200) = $420. So if the best option happened, the gold coin is worth less than $450. (ii) If the probabilities were altered to
the expected value of the prize would equal $450. There would also be other ways (Note: having the probabilities in your calculator makes changing values for this search much easier).
|
|||||||||||||||||||||||||||
6. (i)
E(profit) = 20%×0.2 + 10%×0.5 - 15%× 0.3 = 0.045 so Expected % profit is 4.5%.
(ii) Expected profit on an investment of $2,400 = 2400×4.5% = $108. |
|||||||||||||||||||||||||||
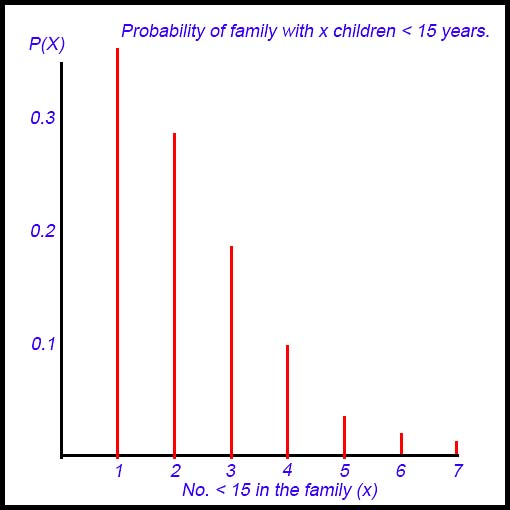
7. (i)
E(x) = 1×0.351 + 2×0.294 + 3×0.194 + ...+ 7×0.009 = 2.26 children
|
|||||||||||||||||||||||||||
| Calculate standard deviation. | 8. Variance = 52 - 62 = 16.
Standard deviation = 4. |
9. Variance = 565 - 222 = 81. Standard deviation = 9. |
|||||||||||||||||||||||||
10. If E(X2) = 25 and SD = 3.
|
|||||||||||||||||||||||||||
| Calculate both the mean and the standard deviation. | 11.
|
||||||||||||||||||||||||||
12.
(i) As a pdf, the sum of the probabilities is 1.0.
(ii) E(X) = 1×0.3 + 2×0.45 + 3×0.2 + 4×0.05 = 2 (as given)
|
|||||||||||||||||||||||||||
13.
|
|||||||||||||||||||||||||||
14. X is a random variable with the following probability distribution:
μ = E(x) = 5(0.05) + 10 (0.30) + 15(0.25) + 20 (0.25) + 25 (0.15)
E(X2) = 25(0.05) + 100 (0.30) + 225(0.25) + 400 (0.25) + 625 (0.15)
|
|||||||||||||||||||||||||||
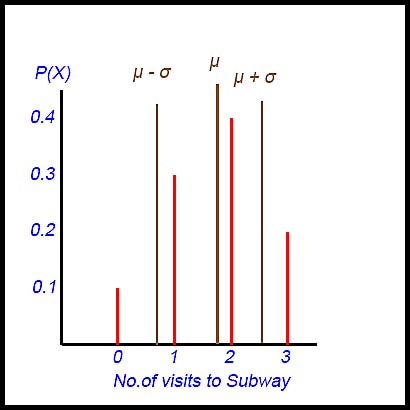
15.
(i) Mean: 0×0.1 + 1×0.3 + 2×0.4 + 3×0.2 = 1.7
(ii) Probab (at least twice) = 0.4 + 0.2 = 0.6 (iii) Pr (X ≤ 1.5) = 0.1 + 0.3 = 0.4 (iv) |
|||||||||||||||||||||||||||
16. (i) E(X) = 1×(1/9) + 2×(2/9) + 3×(1/9) + 4×(2/9) + 5×(1/9) + 6×(2/9)
|
|||||||||||||||||||||||||||
17.
(ii) Tracey: E(X) = 0×0.27 + 1×0.33 + 2×0 + 3×0.40 = 1.53 goals E(X2) = 0×0.27 + 1×0.33 + 4×0 + 9×0.40 = 3.93 Var (X) = 3.93 - 1.532 = 1.6 Alyssa: E(X) = 0×0.13 + 1×0.47 + 2×0.07 + 3×0.33 = 1.60 goals E(X2) = 0×0.13 + 1×0.47 + 4×0.07 + 9×0.33 = 3.72 Var (X) = 3.72 - 1.602 = 1.16. Alyssa may be slightly the better player. She has a slightly better average and the variability of her scoring is smaller. |
|||||||||||||||||||||||||||
18. Jamie's probability distribution is:
(i) Expected number = 0 + 1(0.40) + 2(0.30) + 3(0.26) + 4(0.01)
(ii) E(X2) = 0 + 1(0.40) + 4(0.30) + 9(0.26) + 16(0.01) = 4.1 ∴ Variability = √(4.1 - 1.822) = 0.89 |
|||||||||||||||||||||||||||
19. The probability distribution of the number of butterflies in a garden at 10:00 am each morning is p(X):
(i) Expected number of butterflies = 0(0.5) + 1(0.3) + 2(0.2) + 0
(ii) E(X2) = 0 + 1(0.3) + 4(0.2) + 0 = 1.1
|
|||||||||||||||||||||||||||
20. (i) The sum of the 4 probabilities must = 1. ∴ k + 3k + k + 3k = 1 k = 1/8 or 0.125 (ii)
(iii)
Var (X) = E(X2) - (E(X))2 = 10 - 32 = 1 |
|||||||||||||||||||||||||||
21.
(i) Expected pairs = 4×0.1 + 5×0.1 + 6×0.4 + 7×0.2 + 8×0.2 = 6.3 So I can expect to see 6 pairs of Crested Pigeons. (ii) E(x2) = 16×0.1 + 25×0.1 + 36×0.4 + 49×0.2 + 64×0.2 = 41.1 Hence Var(x) = 41.1 - 6.32 = 1.41. So not much variation from day to day. |
|||||||||||||||||||||||||||