Where the techniques of Maths
are explained in simple terms.
Statistics - the normal distribution.
Test Yourself 1.
- Algebra & Number
- Calculus
- Financial Maths
- Functions & Quadratics
- Geometry
- Measurement
- Networks & Graphs
- Probability & Statistics
- Trigonometry
- Maths & beyond
- Index
| The questions on this page are grouped in categories: |
|
|
|
|
|
|
| Basic area under the normal curve. | 1. In a normal distribution, which three measures are all equal?
Answer.(c) . |
2. What percentage of the total area under the normal curve falls:
|
|
| Area under the normal curve using tables. | 6. Using tables of the normal distriution, determine the percentage of the total area which falls:
|
| 7. Using tables of the normal distriution, determine the percentage of the total area which falls between:
(i) z = -3 and z = -2? (ii) z = +1 and z = +2? (iii) z = - 2.4 and z = +1.6? (iv) z = -0.5 and + 0.5?
|
|
8. An outlier is commonly defined as being a score:
What percentage of the normal distribution lies between these limits?
|
|
| 9. What z score cuts off:
(i) the top 10% of the total area under a normal distribution? (ii) the lowest 20% of the total area under a normal distribution? |
|
| 10. | |
| Determining expected numbers and percentages. | 12. A set of exam results from 25,000 students is assumed to be normally distributed.
How many students from this group are expected to score:
|
| 13. Luke completes a statistical analysis on the weights (in kilograms) of each member of his gym.
He finds that the data are normally distributed, with a mean of 55.0 and a standard deviation of 6.5. Answer.81.5% of members (34% + 47.5%). |
|
| The maximum daily temperatures during the summer months in Cummins Range, W. A. (where Rare Earth minerals are mined) are recorded.
These maximum temperatures are normally distributed with a mean of 21.4°C and a standard deviation of 7.6 °C.
|
|
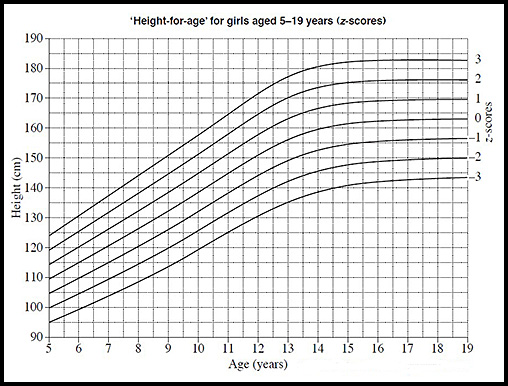
| 14. The following graph indicates z-scores of ‘height-for-age’ for girls aged 5–19 years.
In each age, height is normally distributed.
Answer.(i) z = 1. (ii) Height =135 cm. (iii) 84% will be older (z = -1). (iv) An average (z = 0) 16 year old girl is about 162 cm. |
|
| 15. The weight of tennis balls is normally distributed with a mean of 57.5 grams and a standard deviation of 0.5 grams.
(i) What is the range in weights allowed for one of the four Grand Slam events if the ball is to have a 99% chance of being in that range? (ii) What percentage of tennis balls weigh between 57.5 grams and 58 grams?
|
|
| 16. | |
| 1 tail > | 17. The heights of a group of friends are normally distributed with a mean of 160 cm and a standard deviation of 15 cm.
|
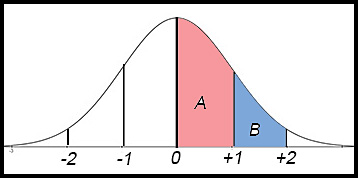
| 18. A normal distribution has a mean of 170 and a standard deviation of 10.
Answer.(i)Any value such that 1 ≤ z ≤ 2. (ii) % = 47.5% - 34% = 13.5%. |
|
19. The heights of 500 students are normally distributed. The mean height is 172 cm and the standard deviation is 3 cm.
Answer.420 students. |
|
20. In a normal distribution, 400 people have a z score less than -2. How many people in this population? Answer.N = 16,000. |
|
| 2 tail even
|
21. Heights of surf lifesavers are measured across a large number of clubs. The average height is 178 cm and the standard deviation was 7 cm.
The percentage of lifesavers between 164 cm and 192 cm was determined to be 88%. What conclusion can be made about the distribution of the heights of lifesavers? Answer.The heights are not normally distributed because we would expect 95% to be in the range+ 2 to -2 standard deviations. |
22. In a normal distribution, 850 people have a z score between -1 and +1. How many people in this population? Answer.N = 1,250. |
|
| 2 tail uneven | 23. Light bulbs have a mean operational life of 6,000 hours. The standard deviation of their operational life is 135 hours. Their operational life is normally distributed. From one batch, 6,194 light bulbs had an operational life of between 5,865 hours and 6,270 hours. How many light bulbs were in this batch? Answer.N = 7,600 light bulbs. |
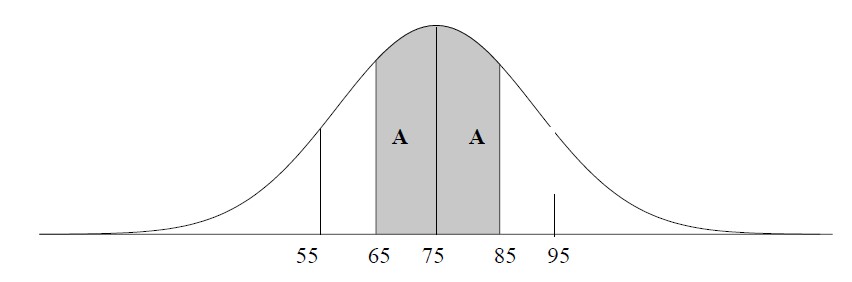
24. . The lengths of 500 widgets manufactured at a particular factory are normally distributed with a mean of 10 cm and a standard deviation of 0.02 cm. The diagram below describes the distribution of the lengths of the components about the mean with the z-scores indicated.
Answer.(i) A z score of -1 means that the length of the component is 10 - 0.02 = 9.98 cm. (ii) A component in section A is between 10 and 10.02 cm say 10.01 cm. (iii) Number = 500 × (47.5%-34%) = 500×13.5% i.e. 68 components approx. |
|
| 25. The heights of 400 students are normally distributed. The mean height is 172 cm and the standard deviation is 3 cm.
Find the expected number of students with a height in excess of 169 cm. Answer.>169 = 34% + 50%.&there4:84%×400 = 336 students. |
|
| 1 tail < | A major seafood chain in NSW and Queensland analyses the hours worked by its staff across all locations. The analysis shows that the average hours worked per week across all permanent and casual staff was 20 hours with a standard deviation of 4 hours. Based on this information and assuming hours worked is normal is normally distributed, what percentage of staff worked less than 12 hours per week? |
The minimum amount of tread that car tyres can legally have is 1.6 mm. A new tyre will have about 8 mm or more of tread. A survey conducted by a leading automobile association recently measured tyre tread depth on 1200 cars across several localities. The survey showed that the mean depth was 5 mm and the standard deviation was 1.6 mm.
|
|
|
|
| (i) 1 ≤ z ≤ 2. (ii) % = 47.5% - 34% = 13.5%. |
|
| Mixed questions | The normal distribution below represents the mass of 400 students. All measurements are in kilograms.
|
The average length of an adult Grey Nurse shark is 3.2 m while the standard deviation of the adult population is 0.4 m.
|
|