Where the techniques of Maths
are explained in simple terms.
Functions - Continuity.
- Algebra & Number
- Calculus
- Financial Maths
- Functions & Quadratics
- Geometry
- Measurement
- Networks & Graphs
- Probability & Statistics
- Trigonometry
- Maths & beyond
- Index
An important characteristic of functions which has wide implications is that of the continuity of a function.
If a curve is continuous at a point, that means that we can trace the curve with our finger through the point and not have to lift our finger off the paper.
If however we have to lift our finger to trace the curve, then the curve is described as being discontinuous at that point.
Our tracing should start on both sides of the point we are investigating. We can then:
- move up to the point from below; and
- then down to the point from above.
Our actions (tracing) then meet at the point we are investigating.
In mathematical terms: |
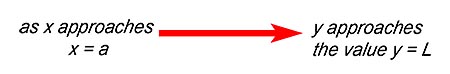 |
That value y = L will be the same regardless of whether we are moving along the curve up to x = a or along the curve down to x = a.
Most curves which are continuous at a given point are also differentiable at that point - but we will come to that extra bit later.
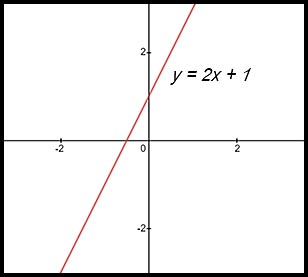
For example, the graph of
The function is therefore continuous. You can see an example of this continuity if you simply select the x value of 0 (that is the y axis). The line approaches y = 1 from values above x = 0 and from below x = 0.
|
 |
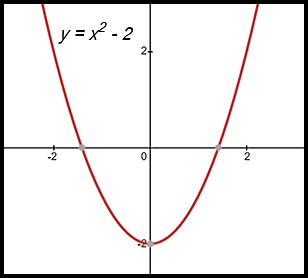
As a second example, the graph of
Examples of x values which demonstrate the continuity are where the parabola cuts the x-axis (x = -√2 and x = √2) and where the parabola cuts the y-axis (when x = 0 and y = -2).
|
 |
In contrast, the graph for  shows the curve is discontinuous at x = 0. shows the curve is discontinuous at x = 0.
The sections of the curve on each side of the y axis continue upwards forever and the two parts never meet. Hence if you are tracing one curve with your finger, eventually you will have to lift it and move to the other curve. |
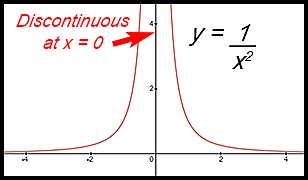 |
So there is no point where the two curves approach and meet at the same value.
Here, the limit of the function, as x approaches 0, cannot be determined. Hence the function is discontinuous.
Putting that in Mathematics-speak, we say that a function f(x) is continuous at x = a
if  .
.
Continuous in the domain.
We can at times restrict the definition for continuity to relate to the domain defined for a function. In the last example, we could than say
that the function is not defined for x = 0. Hence the function
is then continuous because y = f(x) is defined for all values of x excluding 0.
An alternative statement could be, in this example, that
- the curve is continuous for all x < 0; or
- the curve is continuous for all x > 0.
These conditions could be stated together or separately.
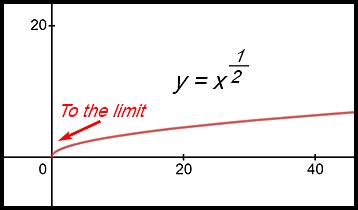
Boundary values
Boundary values for x a limit or an end point for a function.
For example, the curve y = √x is defined only for values of x greater than or equal to 0. In such instances, the definition for continuity is modified so that the limiting value for f(x) is only approached with decreasing x values (i.e. from above 0) but not with increasing x values (i.e. from below 0). |
 |
Testing for continuity.
It is not necessary to apply formal algebraic techniques to test for continuity at this stage.
It is sufficient
to:
- inspect a given equation to determine if there any points of discontinuity which can been found immediately.
Generally such points will be in the context of hyperbolas - for example:the hyperbola
 will have a discontinuity at x = 2 when the denominator equals zero -
thus making a y value indeterminate.
So always look at the denominator of the function, factorise it, cancel when possible and then determine values
which set the remaining terms in the denominator to zero. - sketch a reasonable view of the curve and inspect where discontinuities exist.
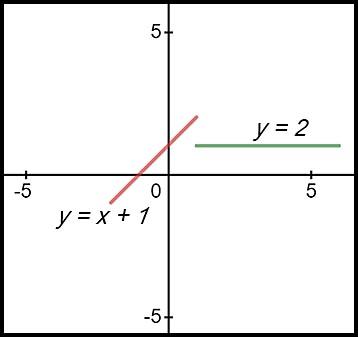
Very often, discontinuities are associated with piecewise functions which are defined within a number of limited ranges for x - for example:
If f(x) = x + 1 when x ≤ 1
= 3 when x > 1The two components are themselves continuous within their respective domains but the function defined with both components is not continuous at x = 1.