Where the techniques of Maths
are explained in simple terms.
Applications of Calculus - Graphs of motion in one direction.
Test Yourself 1.
- Algebra & Number
- Calculus
- Financial Maths
- Functions & Quadratics
- Geometry
- Measurement
- Networks & Graphs
- Probability & Statistics
- Trigonometry
- Maths & beyond
- Index
| The questions on this page focus on: |
| 1. given a displacement graph. |
| 2. given a velocity graph. |
| 3. given an acceleration graph. |
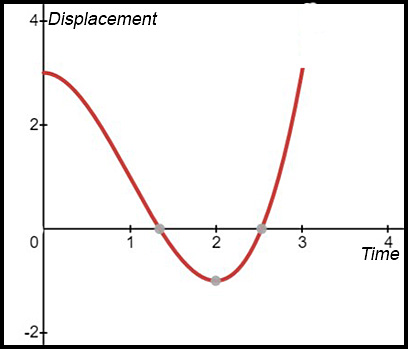
| Given displacement graph. | 1. .JPG)
A particle moves along a straight line for 7 seconds starting at a fixed point S at time t = 0. The graph of x(t) denoting the position of P at time t is shown above. Answers.(i) Particle started at S = 0.5 (approx). (ii) In a negative direction as the gradient is negative. (iii) At t = 1 and t = 4. (iv) At t = 4 seconds. (v) At t = 5 the gradient is negative and the concavity is still negative. So the particle is speeding up in a negative direction - so slowing down in a positive direction. |
| 2. The graph showing the motion of a particle over the first 3 seconds is shown below (displacement in metres).
|
|
| 3. | |
| 4. Sketch a graph of displacement against time given that, during the period of motion, the displacement is always negative, the velocity is always negative and the acceleration is always positive. | |
| 5. Sketch a graph of displacement against time given that, during the period of motion, the displacement is always positive, the velocity is always positive and the acceleration is always negative. | |
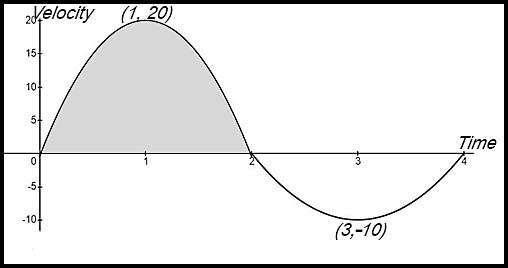
| Given velocity graph. | 6. The diagram below describes the velocity of a particle (in m/sec) over the first 4 seconds.
Answers.(i) 20 m/sec. (ii) Acc = -10 m/sec2. (iii) At t = 2. (iv) Displacement = 10 m. |
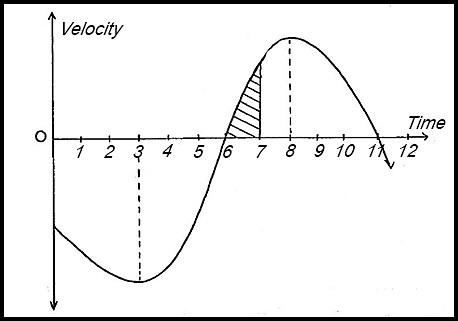
7. 
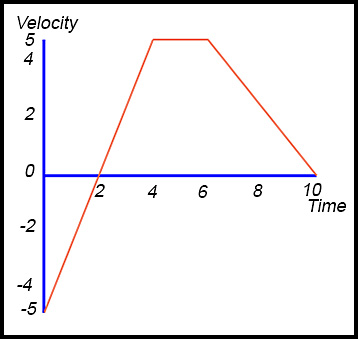
The graph above shows the velocity of a particle against time of travel. Initially the particle was at the origin. Answers.(i) Furthest at 4 secs. (ii) After 7 secs, 4 m to right of origin. |
|
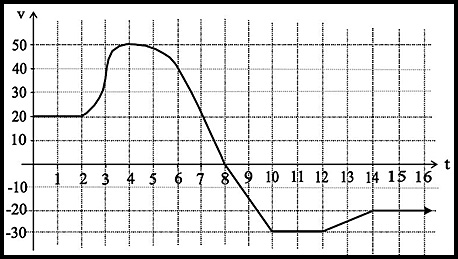
| 8. The graph shows the velocity v (in metres/sec) of a particle, moving from the origin, as a function of time t.
Answers.(i) Max acceleration at t = 3. (ii) Distance = 240 m. (iii) Returns to origin at t = 18 secs. |
|
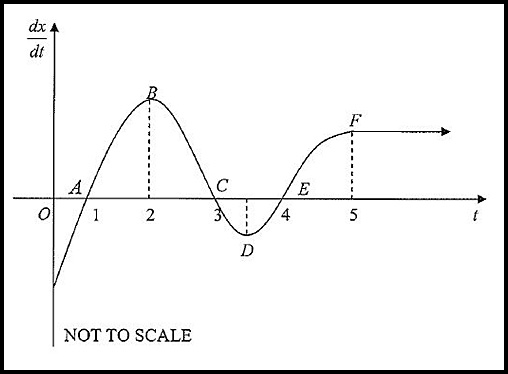
9. 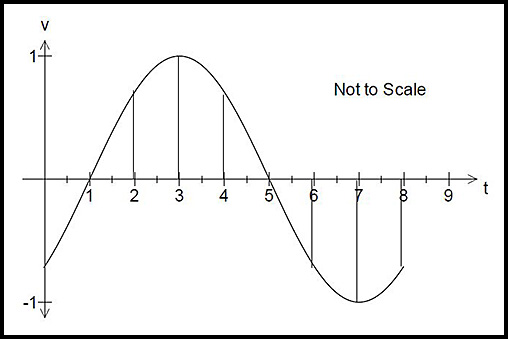
The diagram above shows the velocity-time graph for a particle moving in a straight line. State the times between t = 0 and t = 8 at which: Answers.(i) v = 0 at t = 1 and 5 secs. (ii) t = 3 and 7. (iii) 1 < t < 3 (v & a both positive) and 5 < t < 7 (v & a both negative). |
|
| 10. An object is moving along in a straight line. The graph below shows the velocity (in m/sec), The coordinates of the points on the graph are A (1, 0), The velocity is constant for t ≥ 5.
|
|
11. 
The diagram above shows the velocity-time graph for a particle moving in a straight line.
|
|
12. Below is the graph of a particle’s velocity v in m/sec plotted against time t in seconds. The particle’s motion lasts 10 seconds.
(i) State the time(s) when the particle is at rest. |
|
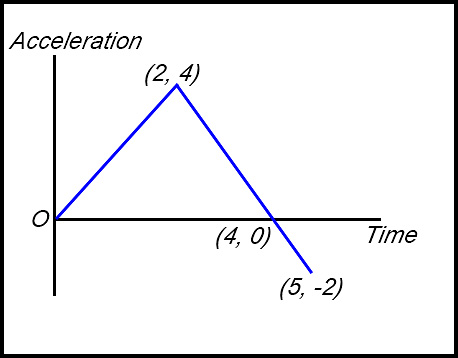
| Given acceleration graph. | 13. The graph shows the acceleration of a particle as a function of time t for the period 0 ≤ t ≤ 5.
|
14.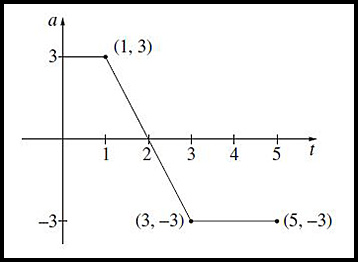
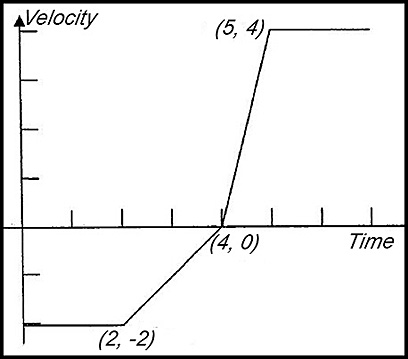
A particle moves along the x-axis. Initially it is at rest at the origin. The graph shows the acceleration a of the particle as a function of time 0 ≤ t ≤ 5. Answer.(i) Max velocity at t = 2. (ii) Final velocity is -3 m/sec. (iii) Furthest from origin at t = 4. |
|
| 15. |